31
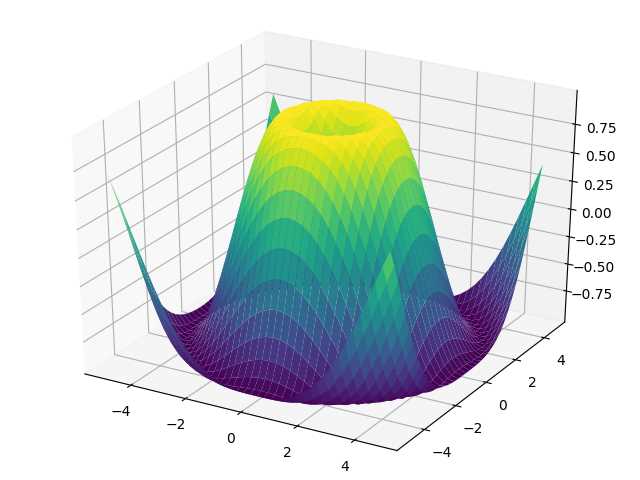
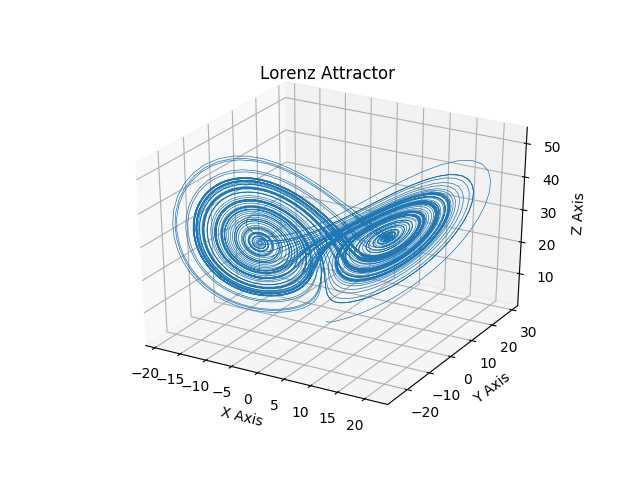
matplotlib er et python 2D planlægningsbibliotek, der producerer tal for publikationskvalitet i forskellige hardcopyformater og interaktive miljøer på tværs af platforme.matplotlib kan bruges i python-scripts, python- og ipython-shell (ala MATLAB® * eller Mathematica® †), webapplikationsservere og seks grafiske brugergrænsefladeværktøjssæt.
matplotlib
Internet side:
http://matplotlib.sourceforge.net/Funktioner
Kategorier
Alternativer til Matplotlib til alle platforme med enhver licens
180
95
56
40
Microsoft Mathematics
Microsoft Mathematics er en grafisk lommeregner på skrivebordet, der kan hjælpe dig med at visualisere og se matematiske begreber, som du aldrig har set dem før.
- Gratis
- Windows
36
python(x,y)
Python (x, y) er en gratis videnskabelig og teknisk udviklingssoftware til numeriske beregninger, dataanalyse og datavisualisering baseret på Python programmeringssprog, Qt ...
- Gratis
- Windows
26
19
15
14
10
Bokeh
Bokeh er et interaktivt python-visualiseringsbibliotek, der er målrettet mod moderne webbrowsere til præsentation.
- Gratis
9
7
7
Dash Reports
Dash Reports er en alsidig og let rapporteringsløsning.Det giver brugere og administratorer mulighed for at oprette en lang række rapporter drevet af SQL-databaser.
7
timeplotters
Timeplotters er kommandolinjeværktøjer til visualisering af tidsdata, især nyttige til visualisering af data fra ad-hoc-programlogfiler for at hjælpe dig med at opdage mønstre og afvigelser, som du ...
