19
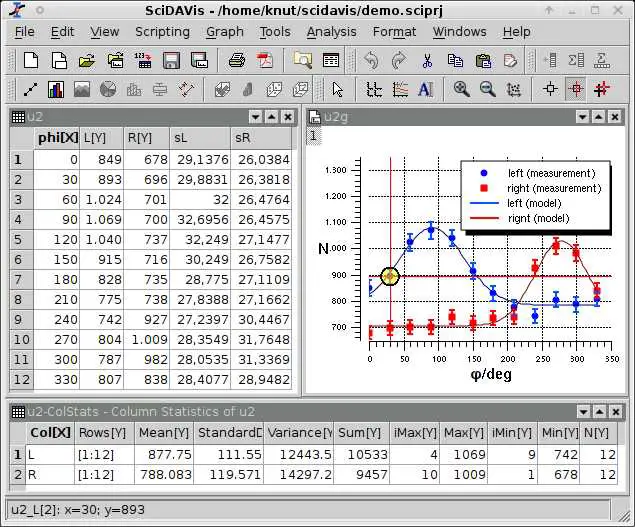
SciDAVis er et gratis program til videnskabelig dataanalyse og visualisering.Det er en applikation, der er rettet mod dataanalyse og publikationskvalitetstegning.Det kombinerer en lav indlæringskurve og en intuitiv, letanvendelig grafisk brugergrænseflade med kraftfulde funktioner såsom scriptbarhed og udvidbarhed.Der findes en ganske omfattende manual:
Internet side:
http://scidavis.sourceforge.net/Kategorier
Alternativer til SciDaVis til alle platforme med enhver licens
95
56
36
python(x,y)
Python (x, y) er en gratis videnskabelig og teknisk udviklingssoftware til numeriske beregninger, dataanalyse og datavisualisering baseret på Python programmeringssprog, Qt ...
- Gratis
- Windows
31
19
14
7
6
5
OmniGraphSketcher
OmniGraphSketcher hjælper dig med at lave elegante og præcise grafer på få sekunder, uanset om du har specifikke data til at visualisere eller bare har et koncept at forklare.
4
4
4
2
2
2
Aveloy Graph
Aveloy Graph er et program til oprettelse af graf / visualisering af data - hurtig, nem at bruge og interaktiv.
- Gratis
- Windows